
SaaS Dashboard UX Design: Hierarchy, Empty States, Data Density
By: Md Tarek · 17 Oct 2026
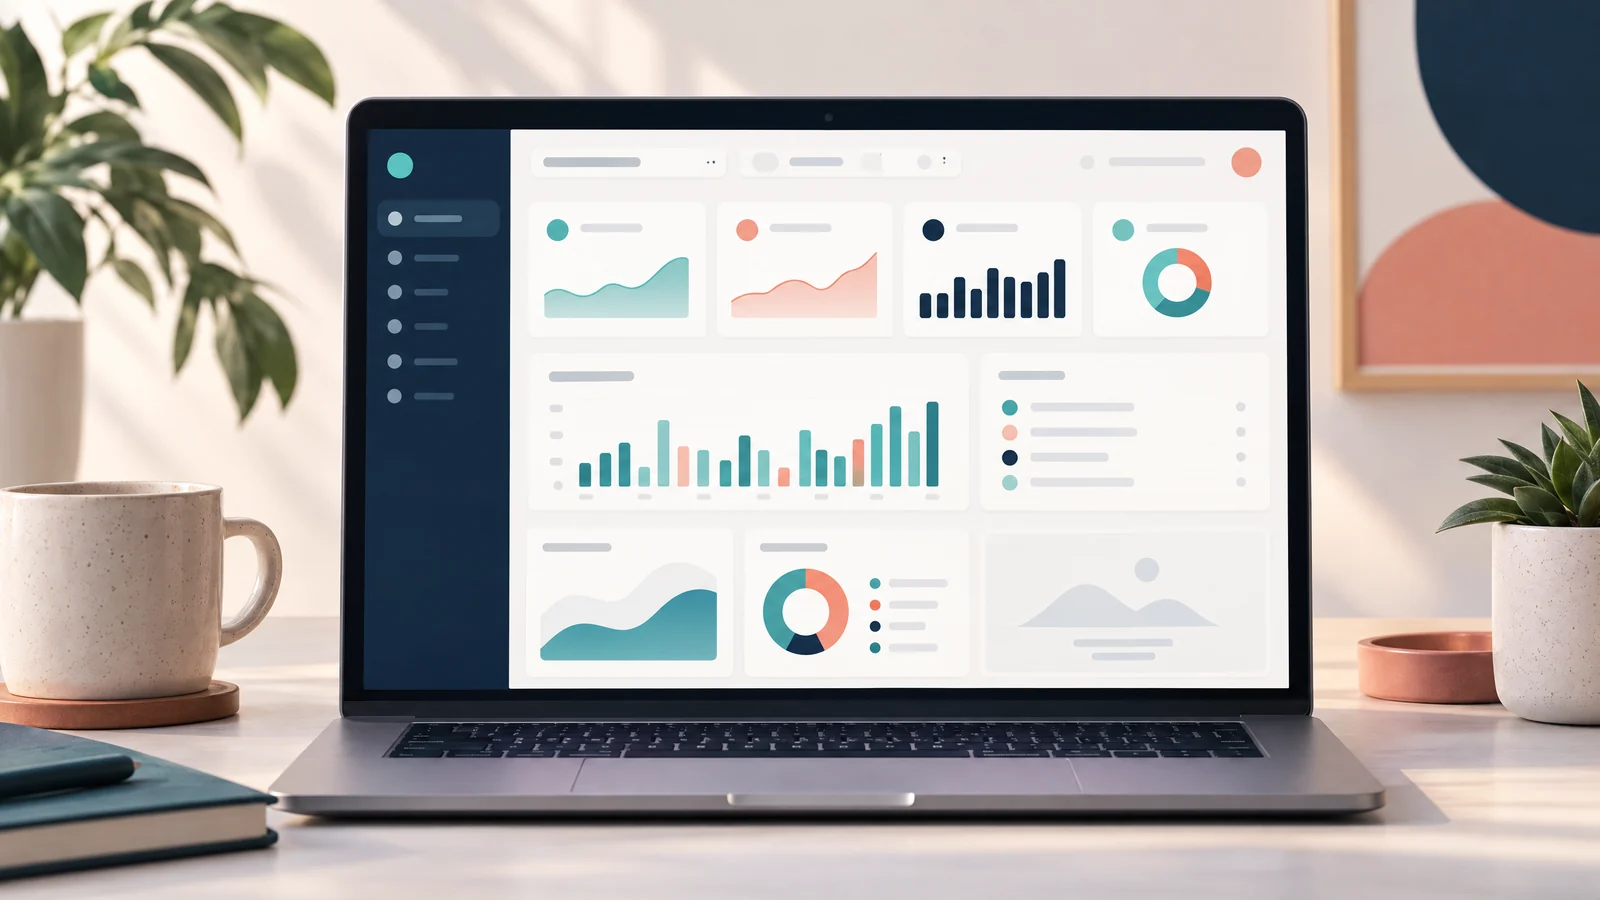
A SaaS dashboard UX design answers one question: what deserves my attention, and what can I do next? Build that answer in three layers: put the highest-value decision first, give every empty state a truthful explanation and next action, and show the most useful data at a readable density. Treat density as a decision.
Start with information hierarchy, not widgets
Before choosing cards, charts, or a sidebar, write the user’s recurring decisions as verbs: approve, investigate, forecast, reconcile, or configure. Rank them by urgency, frequency, and consequence. The first viewport should support the most important decision, not merely display the metrics your database happens to expose.
A practical hierarchy is:
1. Orientation: page title, selected workspace, time range, and a short “last updated” note. 2. Decision signals: a small set of headline values with a comparison period and a clear status. 3. Diagnosis: the trend, segment, or exception that explains a change. 4. Action: a primary button or a link to the next workflow. 5. Detail: a table, filters, export, and secondary settings.
Give each layer a distinct visual job. Use size and placement for priority, labels for meaning, and color for state rather than decoration. A red number without a definition, time window, or threshold is an invitation to guess. Keep the metric’s name and unit visible; use a tooltip only for extra explanation.
Make the hierarchy resilient to permissions and screen size. If a viewer cannot manage members, reflow the remaining content rather than leaving a hole. On narrow screens, move diagnosis below the signal instead of shrinking cards until labels wrap. Use progressive disclosure only when it preserves the main task.
Design empty states as product states
“No rows” is not one state. Distinguish at least four cases: the user has not created anything, the current filter has no matches, data is still loading, or the request failed. Each needs different copy and a different action. “Create your first project” is appropriate for an empty account. “Clear filters” is appropriate for a zero-result search. A retry control belongs to an error, not to a genuinely empty account.
The empty-state message should answer what happened, why it matters, and what to do next. Keep the action local: “Invite a teammate,” “Connect billing,” or “Reset filters.” If the screen’s purpose is unfamiliar, add brief, contextual education. Material Design recommends starter content for content-creating apps and says educational content should be brief, contextual, and dismissible. [1] Do not turn one blank table into a tour of the entire product.
Loading deserves its own state. Reserve space for the final shape so the page does not jump, but do not use an animated skeleton to imply that data exists when the server has returned none. After a request finishes, announce useful non-focus-changing updates such as “18 results returned” or “No results returned” through an appropriate status mechanism. WCAG describes these as status messages and requires that they be programmatically determinable without receiving focus. [2] Avoid making every minor refresh an assertive alert; excessive announcements are distracting, and the same guidance warns that live regions can make an application too chatty. [2]
Make data density useful and accessible
Data density is useful when it reduces search and comparison effort. It is wasteful when it removes context, forces horizontal scrolling, or makes errors hard to spot. Start with a default view that supports the common task. Offer compact mode, column selection, saved views, and pagination for expert users, but preserve readable labels and a way back to a sensible default.
Prefer a table when users need exact values, sorting, scanning, or comparison. Use a chart when the relationship or direction matters, then provide the underlying values in an accessible form. Every column should have a purpose: if a value does not change a decision, move it to detail view or remove it. Show units, currency, timezone, date range, and data freshness near the data rather than in a distant help page.
Use real table semantics instead of styling a grid of div elements. W3C says header cells should use <th> and data cells <td>; scope, id, and headers can express more complex relationships. [3] MDN also recommends a <caption> that identifies the table’s purpose and explains that scope helps assistive technologies associate headers with cells. [4] A compact, valid baseline looks like this:
<table>
  <caption>Open invoices for the selected workspace</caption>
  <thead>
    <tr>
      <th scope="col">Invoice</th>
      <th scope="col">Customer</th>
      <th scope="col">Due</th>
      <th scope="col">Amount</th>
    </tr>
  </thead>
  <tbody>
    <tr>
      <th scope="row">INV-1042</th>
      <td>Northwind Studio</td>
      <td><time datetime="2026-10-31">Oct 31, 2026</time></td>
      <td>$1,240.00</td>
    </tr>
  </tbody>
</table>
Do not let density become a security leak. A dashboard may reveal customer names, payment status, internal identifiers, or aggregate values that become sensitive when combined. Enforce authorization on the server for every request, not only by hiding a column or button in the client. OWASP recommends least privilege, deny-by-default behavior, and server-side checks because client-side controls can be bypassed. [5] Apply the same policy to exports, drill-down endpoints, cached responses, and static files. Redaction can improve privacy, but it can also make totals misleading; label partial data and explain why a value is unavailable.
Common mistakes to remove before launch
- The executive junk drawer: ten equal cards and three competing “primary” buttons. Remove low-value metrics and make one decision path visually dominant.
- The universal empty message: “Nothing here yet” for loading, errors, filters, and permission failures. Model states separately and give each a truthful action.
- The color-only dashboard: red, amber, and green without text, icon meaning, or a value. Pair status color with words and preserve contrast.
- The desktop table squeezed onto mobile: let users choose columns, stack secondary fields, or open a row detail view. Do not silently omit values that change the decision.
- The decorative chart: a visually impressive plot with no units, range, comparison, or accessible data. Prefer a smaller chart that answers a specific question.
- The front-end permission check: hiding “Export” while leaving the export endpoint open. Test denied roles and cross-workspace identifiers at the API boundary.
FAQs
Should every dashboard start with KPI cards?
No. Use KPI cards only when a small number of values genuinely orient the user. A queue, task list, or exception table may be the fastest route to action.
How much data should the default view show?
Show enough to complete the primary task without opening another screen, then stop. Validate that choice with representative users and real workflows; density has no universal pixel or row target.
References
[1] Material Design: Empty states
[2] Understanding WCAG 2.2 Success Criterion 4.1.3: Status Messages